Another Black Mark on September
The Dow Jones
Industrial Average has had 1016 triple digit
moves in its history, the first of which was
in 1987. While overall there are roughly the
same number of up days as down, today's loss
of 185.68 points makes September the month
with the greatest percentage of negative
triple digit moves. Two of the top three
biggest point drops of all time occurred in
September -
-
Sept
29, 2008: Dow drops 777.68
-
Oct 15, 2008: Dow drops
733.08
-
Sept
17, 2001: Dow drops 684.81
Of note, October
has the most triple digit moves in total.
Get
more September
stats here

Will 2010 Be as Good as 2009?
Tuesday December 29, 12:28 pm ET
By
Simon Maierhofer
John Templeton's observation that bull markets are born on pessimism,
grow on skepticism, mature on optimism and die on euphoria might never
have been more apropos than it is today.
There are
many pieces of Wall Street wisdom, some work, others don't, but John
Templeton's quote is one to remember. In fact, it may be the single most
important and most profitable principle for investors.
History
shows that this principle is as easily forgotten, as it is simple.
That's probably what makes it so effective. Investors, in particular
fund managers and analysts (more about that in a moment), should frame
John Templeton's advice and display it prominently, or use it as
screensaver.
The reason
we talk about investor sentiment is because it has reached extremes not
seen in years. Couple this with a 65% rally in the S&P (SNP: ^GSPC), Dow
Jones (DJI: ^DJI) and Nasdaq (Nasdaq: ^IXIC) and you have a possible
recipe for disaster.
A
bittersweet privilege
21st
century investors had the bittersweet privilege of eyewitnessing the
bust of several bubbles. Even though the bubbles all occurred in
different asset classes, they had one common denominator - sudden and
unexpected destruction.
A balloon
that has been punctured does not deflate in an orderly way. That has
been the case with technology (NYSEArca:
XLK -
News) in 2000, real estate (NYSEArca:
IYR -
News) following its 2005 top, and
the broad U. S. stock market (NYSEArca:
SCHB -
News), which topped in 2007 and
tumbled in 2008/2009.
If you are
one of the lucky few investors who foresaw all those asset bubbles,
there is no reason to continue reading, if you aren't, it might be a
good opportunity to reevaluate following the guidance that didn't keep
you out of asset bubbles.
2010 - On
the cusp
As 2009 is
winding down, various indicators have reached trigger levels not seen in
months, even years. None of those trusted gauges have bullish
implications. This means that 2010 might get off to a very rocky start.
The
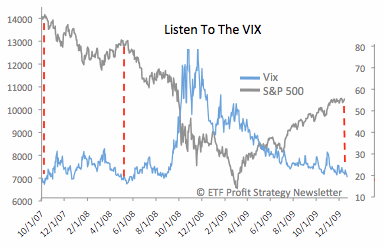
Volatility Index (Chicago Options: ^VIX), also called VIX or fear index,
measures how concerned options traders are that prices will drop. As
with all sentiment indicators, the value of the VIX lies in its
contrarian application. For the first time since August 2008, the VIX
has now dropped below 20; a reading that has foreshadowed trouble in the
past.

Shortly
after this August 2008 extreme, the ETF Profit Strategy Newsletter
brand-marked the financial sector (NYSEARca:
XLF -
News) a 'downward spiral with no
stop-loss provision' and recommended short ETFs such as the UltraShort
Financial ProShares (NYSEArca:
SKF -
News) and UltraShort S&P 500
ProShares (NYSEArca:
SDS -
News).
Within six
months of the August VIX extreme, the S&P (NYSEArca:
SPY -
News) lost 45%, while financials
dropped over 75%.
Looking
back further, we notice that the VIX also fell below 20 in May 2008.
Just from May to August 2008, the S&P dropped 12%. Of course, the VIX
also fell below 20 in October 2007. We all know what happened
thereafter.
Be careful
who you trust
Most of us
look for a pro when it comes to matters beyond our knowledge. For a
health issue, we visit a physician, for car trouble we go to a mechanic,
etc. When it comes to investment guidance, however, trusting an advisor
may not be the best thing to do.
Investors
Intelligence is an organization that tracks about 140 financial
newsletters. In October 2007, 62% of the polled newsletter
writers/advisors thought prices would go up further. Only 19.6% were
bearish. The rest thought that the market would move higher after a
brief correction. We know today that 81.6% of those advisors were proven
wrong.
The
opposite happened in March 2009, when only 26.4% of the advisors were
bullish. This time, 73.6% were proven wrong. Going against the grain,
the ETF Profit Strategy Newsletter issued a strong buy alert on March
2nd. Stocks have rallied 65% since.
From
blessing to curse
What goes
up must come down. That pattern has been established by history and the
latter part (coming down) generally happens when least expected. This
65% rally from the March lows has morphed from blessing to curse. Now
that the profits have been reaped, all that this rally does is mortgage
2010 growth.
The above
Investors Intelligence and VIX readings show that the majority of
traders, investors, and advisors did not see any of the major market
turns coming since 2007. In fact, the vast majority of Wall Street has
been wrong-footed consistently.
Once
again, investors and advisors have set the stage for a major blindside.
The number of bulls tracked by Investors Intelligence has reached the
highest level since December 2007 while the number of bears clocked in
at the lowest level in over six years. This is in addition to the
message conveyed by the VIX.
The extent
of the damage
We
mentioned above the declines following extreme readings in October 2007,
May 2008 and October 2008. Each decline was different in character but
each lead to lower lows. October 2007 was followed by lower prices in
May 2008, which was followed by lower prices in September 2008.
The
rallies in between the above-mentioned secondary highs never advanced
beyond flash in the pan status and did nothing more than once again
trick investors into buying stocks at higher prices. Odds are, the rally
from the March low will become known as the biggest flash in the pan, or
sucker rally, since the Great Depression.
But, this
time is different
The most
fascinating facet of investment research is the consistent appearance of
the 'this time is different syndrome.' The market does what it's always
done, but every time a top of larger degree is upon us, we find excuses
for stocks to move even higher - just to be disappointed time and again.
If the
stock market were a person or entity, it would probably compare
investors to a poker player that falls again and again for the same
bluff. The best way to call your opponents bluff is by knowing his hand.
Well, here's what the stock market has in store for us.
Perception, to a large extent, is what drives the market, but perception
is not real. Perception, like a poker player's face (aka poker face) can
differ widely from the true value (aka the actual hand of cards).
If you
boil it down to the basics, you come up with this formula:
Valuation
+ Perception = Market Value
Obviously,
perception is the big fluctuating variable. Eventually, however, the
market will always disregard perception and reset the market to its
proper valuation. At that time the formula is: Market Value = Valuations
In other
words, your opponents poker face may be enough to up the ante for a
while, but when it comes time to settle the score, only what's in your
hand counts. The same is true for stocks. In the end, only true value
counts.
Calling a
bluff
With its
gravitation like pull, the market has a way of bringing stocks down to a
fair valuation level. This level can be measured by simple yet effective
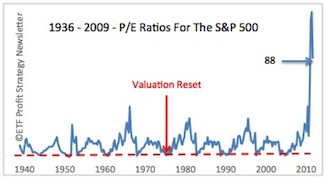
indicators such as dividend yields and P/E ratios.

Major
market bottoms, such as in the 1920s, 1930s, 1950s, 1970s, and 1980s saw
P/E ratios drop to multi-decade lows while dividend yields rose to
multi-decade highs. Right now - and even nine months ago - P/E ratios
are the highest they've ever been, while dividend yields are close to
their 1999 all-time lows - the opposite of what you'd expect to see at a
market bottom.
The
November issue of the
ETF Profit Strategy Newsletter
includes a detailed historical analysis of P/E ratios, dividend yields,
and other reliable indicators plotted against current prices to
determine a target range for the ultimate market bottom. Indicative of
their implications, we've dubbed the indicators the 'Four Horsemen' -
yes, the March lows are in serious danger.
It may not
be apparent just yet, but the market is bluffing its way to higher
prices. The time to settle the score is speedily approaching. Will you
call the market's bluff and prepare for a major decline, or will you be
blindsided into holding stocks at the worst of times?

|

